Power generation, process automation, and factory automation in manufacturing industries require rigorous, continuous monitoring in the control room. The GX paperless recorder series is Yokogawa's latest recorder offering for industrial automation.
The GX paperless recorder series is an industry-first multi-point touch panel, to improve intuitive and smart operator control. Users can scroll, pan, zoom historical data, and even write freehand messages on its dust-proof and water-proof display. The Yokogawa GX paperless recorder series delivers industry leading reliability and measurement accuracy. Its custom graphics accommodates application or process-specific displays, while a wide range of communication protocols guarantee compatibility with your network architecture. It's simple for operators to view and retrieve past data with automatic email and FTP notifications.
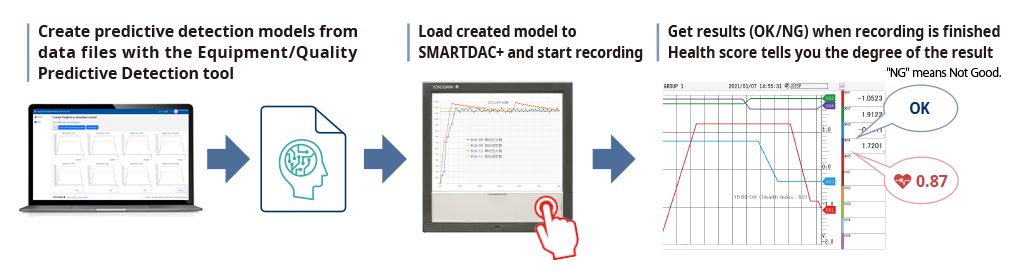
* Creating predictive detection models and profile waveforms requires the Equipment/Quality Predictive Detection tool (sold separately).
By easily creating predictive detection models from past recorded OK/NG (Not Good) data and loading it into GX/GP, you can detect prediction of abnormalities in manufacturing equipment and product quality degradation at an early stage. And because health scores which show the degree of normal and abnormal data consider correlations among multiple data to make determinations, they can capture prediction of abnormalities that are difficult for humans to detect.
|
Health monitor function empowers you to:
|
 |
By creating a profile waveform from past recorded data and loading it into GX/GP, this waveform can be used as a threshold for process values. Profile waveforms are useful in applications where process values change over time. Also, you can see the deviation from the reference waveform on the screen.

|
Profile function empowers you to:
|
 |
By creating predictive detection model and profile waveform, Cloud or Offline Equipment/Quality Predictive Detection tool (paid separately) is required. To use cloud version, you need to apply from the following site to create an account.
*There are some functional restrictions during the free trial period.
> Click here to apply for the cloud version
> Click here to download the offline version
*Search "OE10" on the member's site.
Note: Cloud version is available only for US, Canada, EU and UK.
AI comes standard on the GX/GP. No complicated settings. Simply register channels, and you're ready to draw future measured data on those channels.
Future PenUse acquired data to predict future data, and display predicted future waveforms along with real time data on the trend monitor. Predicted future waveforms help you identify and deal with likely problems as soon as possible.
|
Future alarmsYou can set future alarms based on future data predicted by the future pen. You can check future alarm information in the Future Alarm Summary screen. Also, when a future alarm occurs, notification can be sent by external (digital) output or email. Because the future alarm information also includes the predicted alarm time, you can also identify the urgency. |
 |
 |
An intuitive UI engineered for ease-of-use
|
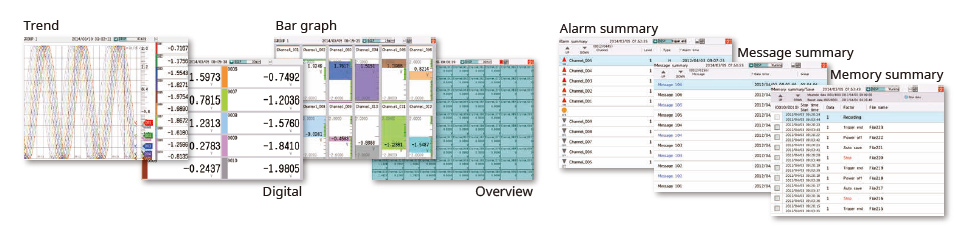
Quickly find data using calendars and summary screensFrom a calendar, jump to waveforms of a specific date. From the alarm summary, jump to the waveform active during the alarm. |
|
|
 |
Write freehand messagesImmediately clear areas of concern with a hand-written message. ou can draw or hand-write on the waveform area using a stylus or the tip of your finger. |
Save and output image filesSave trend waveforms of interest or screens displayed during alarms as image (PNG) files, and print them out at the same time. |
 |
 |
Display digital values at any locationMove the scale to display the value corresponding to that position as a numeric value. Instantly check maximum/minimum measured values. |
Ascertain long-duration trends at a glanceAll historical trends display |
 |
 |
Zoom in/out - time axis and engineering unitsThe time axis and engineering axis can expanded and compressed using a simple pinch together or apart function |
 |
Physical quantities are displayed and recorded on a log scale.Log scale display (/LG option |
Multi-panel displayYou can select from 9 layouts, and save up to 20 configurations. (Multi panel available on the GX20 only) |
 |
 |
Various pre-configured control screens and display are available.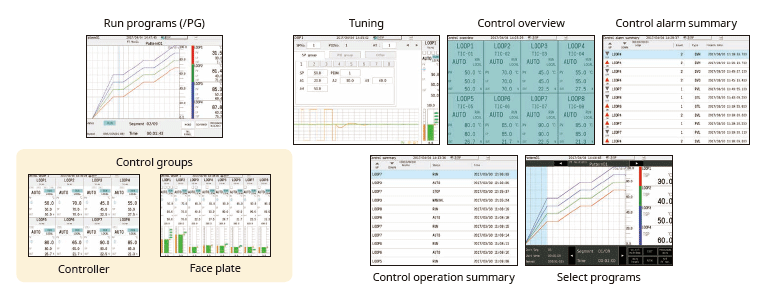
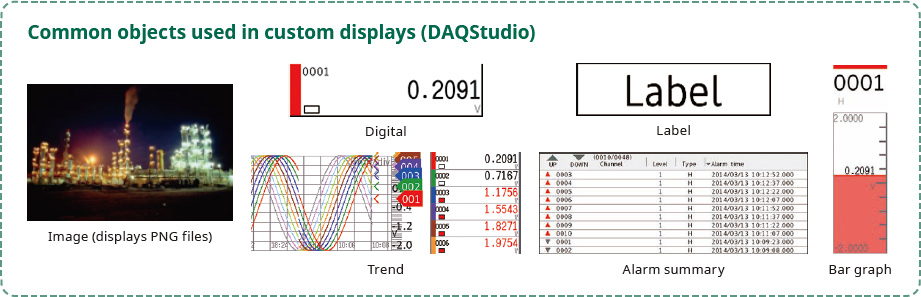
Custom display (/CG option)You can arrange display objects such as trend, numeric, and bar graphs any way you like to create monitor displays that are customized to the environment. Start/stop pumps and perform other operations. |
 |
Custom display building software
|
 |
Modular input/outputInputs and outputs are modular for easy expandability. The GX multichannel paperless recorder main unit alone provides up to 100 channels (GX20) of measurement. |
 |
Wide variety of input/output modulesSelect from a wide variety of input/output modules |
 |
